We’ve all been there—working with hundreds of data rows in Google Sheets. It all makes perfect sense to us. But when your SEO agency client requests a report, we can’t exactly send over a vast spreadsheet and expect them to sort it out.
So, what do we do? We copy-paste and format for hours to present the data as well-structured slides. It’s time-consuming and even a bit stressful.
But guess what! You no longer have to do it by hand!
With Google Apps Script, you can inject data from Google Sheets into a template in Google Slides and generate hundreds of pretty slides in just minutes.
Let’s say your executive wants to be able to see how well inbound marketing is working, but doesn’t want to look at a giant table of URLs stacked on top of each other. We will use an export of the Behavior > Landing Pages report from Google Analytics and generate a slide for each page in the report with the metrics bulleted out. Let’s check out how you could make it happen.
Getting Started In Your Container’s Script Editor
The first thing to understand about the Google Apps Script is that the script needs to be built into a “container,” which is a file of the G Suite Service that will contain the script to be run. The container usually has some initial setup for the script, too.
For our case, our container will be a Google Slides file. It will have a title slide and then a slide that will serve as a template.
Make a copy of this container presentation
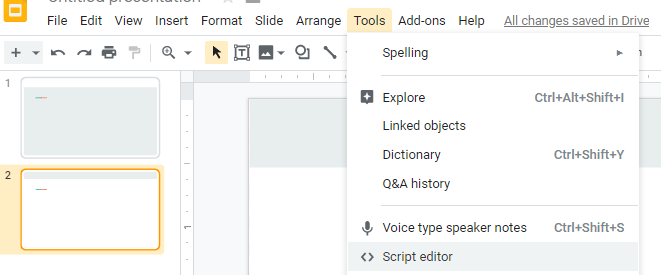
Once you’ve set up your container, just open Tools > Script Editor to start writing your function.
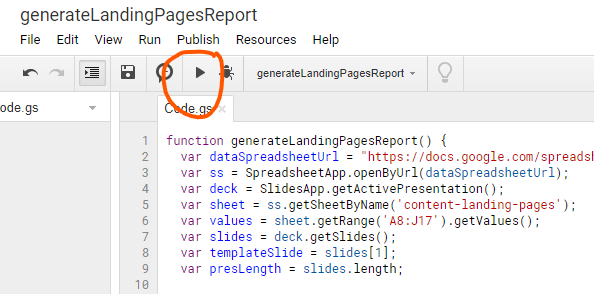
While you could just dive right in and run the script (just push play) within this container, let’s go over how it works, so you can start customizing it for your own needs.
Using the Script Editor
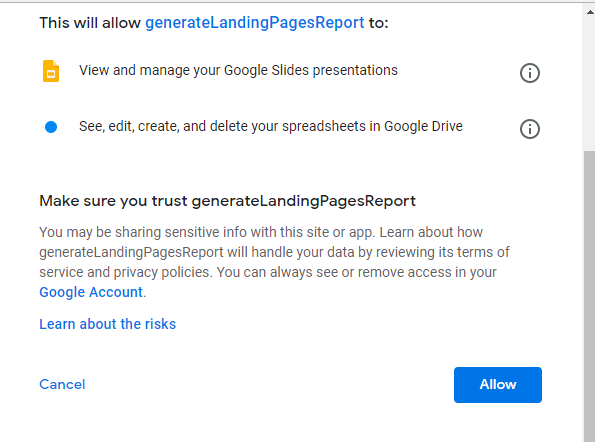
The first time you run your script, you will be required to ‘allow’ Google to view, manage, edit, etc., your apps.
If you’re running a script from someone else’s file (like in this example), you might see a warning that Google hasn’t verified the source. Don’t worry—it’s just a standard security check. As long as you trust the code, you can open the Advanced options and go ahead to the function.
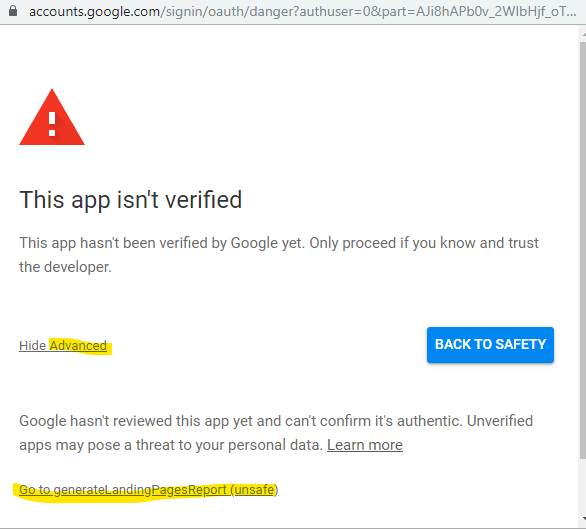
Once approved, the script should continue running.
When a script runs, you’ll see an alert at the top of the editor. Once it is stopped (provided no error message has appeared), your script should have completed!

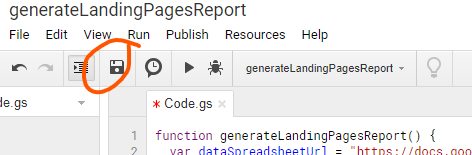
As you update, make sure you are saving! When you have unsaved changes, a little red asterisk will appear.
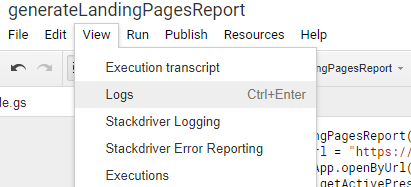
To see the outputs of your variables, use “Logger.log().” Access the logs from within the View menu.
Understanding the Google Apps Script Classes
JavaScript experts may think you are ready to get coding. However, there are a couple of differences. For starters, use Logger.log instead of console.log. The biggest difference is that you won’t be traversing a DOM. Instead, you’ll have to understand the different classes for the various apps.
**THIS IS THE MOST IMPORTANT ASPECT OF USING GOOGLE APPS SCRIPT!**
Each app has a hierarchy of classes. Once you understand the hierarchy, you can then move about the app and reference the appropriate class documentation (which will be linked each time a new class is referenced here), to determine what properties and methods are available for the class.
Sheets Classes
For Google Sheets, everything begins with the parent class SpreadsheetApp. Even though there are many classes within, we will be using the Spreadsheet, Sheet, and Range classes. These classes have a nicely defined hierarchy.
Slides Classes
The Slides service is SlidesApp, which works with the Presentation class. We will also be using the Slide, Shape, PageElement, and TextRange classes. When reviewing the documentation, you’ll see that sometimes these classes can be children or siblings, which makes for a messier hierarchy. The “Return Type” in the methods documentation is key to ensure your output is the type you need and expect.
Accessing Your Apps in The Script
Both the parent classes we are working with can use the following methods for opening them.
- openByUrl()
- openById()
- getActive…()
If your script is contained within a Spreadsheet, you can use getActiveSpreadsheet(). Since we are working out of a Slides container, we will use getActivePresentation().
As it is easier for all team members to use the full URL of their Sheets, we will use that method for Sheets. To switch out spreadsheet URLs more easily, we will put the URL into its own variable. The variable name will then be used within the functions.
Let’s declare the files we are working with:

You’ll replace “full url here!” with the actual URL of the spreadsheet, including the /edit at the end. Check out our URL shortener to shorten your spreadsheet links to keep it simple. Be sure to keep the quotes to ensure your dataSpreadsheetUrl variable is a string. Here’s how it appears in the completed script:

The actual Spreadsheet we will be working with is this Sheet generated from a Landing Pages report from Google Analytics (GA), but with dummy data. The typical daily index at the bottom is removed. It is important to retain the structure of the export as the script will be looking for the data range based on the format and mapping it based on the columns. That spreadsheet’s URL has been placed into the dataSpreadsheetUrl variable within the script.
Getting Your Data From Google Sheets
Now that we have declared a Spreadsheet, we need to get the correct Sheet (aka tab) within it and set the range of data we will pass to Slides.
The variable “ss” is now a Spreadsheet type. A method of the Spreadsheet is getSheetByName().
The default tab name from generating this report from Google Analytics is “content-landing-pages.” Thus, we will declare the sheet with getSheetByName(‘content-landing-pages’).

Now, we need to declare the range of data within our Sheet. The getRange() method on the Sheet class has several variations that pass different parameters. For the sake of this project, we should always know the exact range, so we can use the A1 Notation version. In case you need to automate from reports where the range is unknown, set a variable for sheet.getLastRow() and sheet.getLastColumn() to put those variables in as the numRows and numColumns parameters, respectively.
When reviewing our data of just the top 10 Landing Pages, our A1 Notation range, which does NOT include headings, is A8:J17. If you export more results than that, be sure to change the row to 17.
Once you have a Range, you can then use the getValues() method, which generates a two-dimensional array ([][]) with the first index being by row and then by column. I’ll refer to these later as the “rows” array and the “columns” array. Note that hidden rows and columns in the spreadsheet will still be grabbed.
We will get the range and values in one declaration:

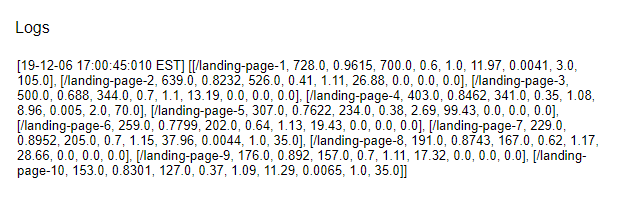
Using “Logger.log(values)” immediately after that declaration, I was able to see what our data looks like in this two-dimensional array.
Now that we have data, let’s place it into our presentation!
Find the Appropriate Slides Inside the Presentation
As mentioned previously, Apps Script containers usually have some initial setup. For Slides, you need to set up a template slide or slides. The one we are working from is set up to have a title slide and then a two-column layout slide with placeholder tags that will indicate where to inject the data. We will duplicate our template slide for each row of data we have.
Our template slide, pictured below, has {{landing page}} in the title with some of our analytics data bulleted out, using curly braces to identify placeholder tags. I’m using curly braces to set these off from other formatting and text that will not be replaced.

First, we need to access our template slide. The Presentation we’ve declared in our “deck” variable can now use the getSlides() method to get an array of all of the slides.

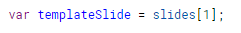
Now we have an array with a Slide at each index. Because we have a title slide before our template slide, we will be using slides[1] to access the template slide, as this is a 0-based index.
Since we will be adding slides to the presentation to create a new slide for each row of data, we need to continuously update our array of slides (as we did when declaring the slides variable) and its length, which we do by:

Now we need to loop through the “rows” in our two-dimensional array to replace the individual text for each Landing Page. Because our values are representative of a webpage, I will set “page” as the element we process in the callback function.

Just to check that we didn’t get an empty row in our data range, I include a conditional to ensure that the Landing Page field, which is now the first in our index of columns, exists.

Within our loop, we need to do the following actions:
- Map all of our “columns” data to variables
- Duplicate our template slide and declare the new slide
- Replace our placeholder text on our new slide. This will have to be done inside another loop of all of the shapes within the slide
- Move our new slide to the end of the presentation to retain the order
Map All of Our “Columns” Data to Variables
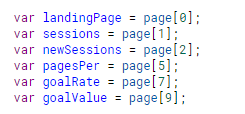
Right now, we are in a loop of each row of data from our two-dimensional array. Each row is an array of data from the columns in our range. We need to review our column headings and map them to variables in our Apps Script.

We are only going to use the data from Landing Page, Sessions, % New Sessions, Pages/Session, Goal 1 Conversion Rate, and Goal 1 Value.
As mentioned with the conditional statement, page[0] is the Landing Page. So, page[1] is Sessions and so on.
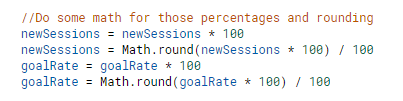
Those already quite familiar with coding know that numbers can be quite irritating. While we want to represent the newSessions and goalRate as percentages, our script has pulled it from the sheet as a plain number that is also not neatly rounded. So, we need to do some math to get the output we’d like.
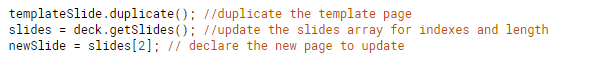
Duplicate The Template Slide and Declare the New Slide
With our templateSlide variable, we can run the duplicate() method, which will place the duplicate after the templateSlide. We must then update our slides array to find and declare the duplicate slide. Since we started with only multiple pages, the new slide will be the third in the presentation, or second in our index. We do all this because we want to retain our template for the next slide in our array.
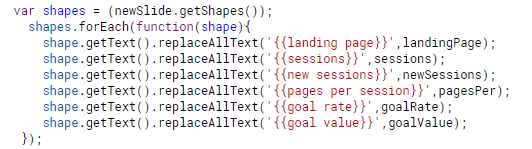
Replace Our Placeholder Text
As mentioned, this step requires another loop. We have to use the getShapes() method on the Slide, which will return an array of all shapes on the Slide. Within the array, each Shape can use the getText() method to return the TextRange, which will then allow us to replaceAllText() for each of our placeholder tags.
We’ve gone ahead and closed out that forEach loop on the shapes. But, we are still in our “rows” loop from the two-dimensional array, or values variable. Before we close, we want to update the order of slides.
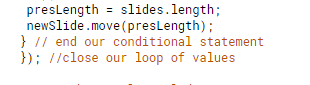
Move the Slide
Update the slides array and length so that our current page in the values array will always be the last slide. Use the move() method to move to the Slide to the end of the presentation.
Don’t forget to remove your template slide.

Now save and run your script. Once the alert at the top of the editor is gone (and error-free), head back to your container presentation to bask in all your automated glory.

While this is just one example, knowing how to inject data from several rows of Sheets into Slides has so many uses in digital marketing. Think of the many reports that need deeper analysis, page by page: SEO content audits, technical requirements, mapping event tracking, etc. Hopefully this gets you exploring the possibilities within Google Apps Script!


